

Key Takeaways
Crash Test
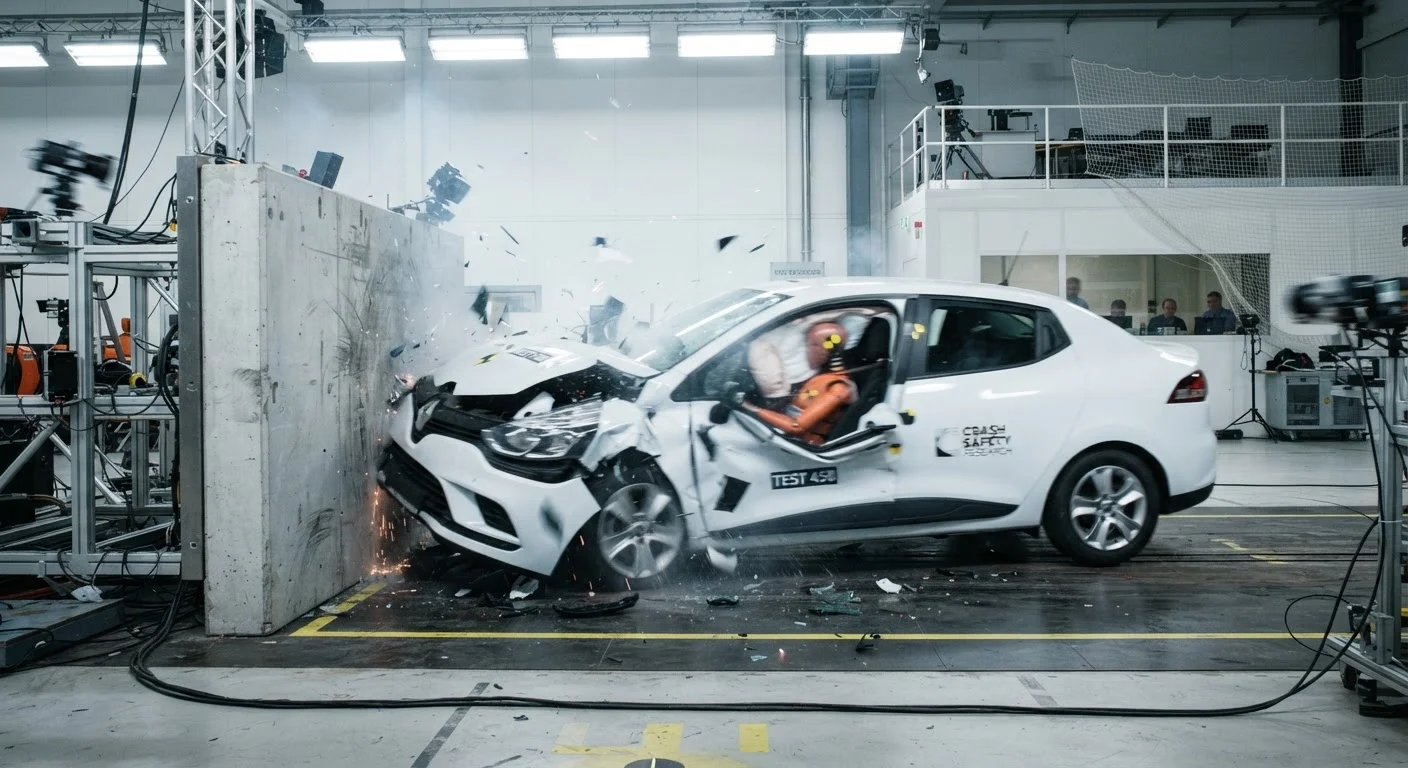
A crash test is a controlled laboratory procedure in which a vehicle is propelled into a barrier, another vehicle, or a moveable object at a specified speed to measure how well the structure protects occupants during a collision. Sensors inside instrumented dummies record forces on the head, chest, and legs throughout the impact. Engineers analyze that data to score the vehicle's structural performance and occupant protection.
Peak deceleration forces during a frontal barrier test can exceed 30 g for 80-100 milliseconds - conditions human anatomy cannot safely sustain without engineered protection.
Setting Up the Collision: Barriers, Sleds, and Speeds
Before a vehicle ever makes contact with a barrier, engineers make precise decisions about test configuration. The type of barrier - rigid concrete wall, deformable aluminum honeycomb face, or a moving deformable barrier (MDB) representing an opposing vehicle - determines which crash scenario is being replicated. A rigid full-width frontal barrier simulates running into a solid obstruction; a small offset rigid barrier replicates clipping a tree or oncoming vehicle with one corner of the front end.
Speed is equally critical. Kinetic energy scales with the square of velocity (KE = ½mv²), meaning a 40 mph impact carries significantly more energy than a 35 mph one despite the modest difference in speed. Test speeds are therefore chosen to represent statistically common fatal and serious-injury crash scenarios documented in real accident data - not arbitrary round numbers.
The vehicle is typically propelled by a cable-and-winch system along a precisely aligned track, ensuring it strikes the barrier at the exact angle and speed specified. Even a small deviation in angle would invalidate the comparison against earlier tests. Understanding how each IIHS test scenario is configured provides further context on barrier geometry and offset angles.
What Happens to a Vehicle in the First 150 Milliseconds
The entire destructive event in a frontal crash test unfolds in roughly 150 milliseconds - less than a human blink. In the first 30 ms, the front fascia and bumper beam absorb initial contact energy. The engineered crumple zone begins collapsing in a controlled sequence, converting the vehicle's kinetic energy into deformation work rather than transmitting it directly to the passenger compartment.
By 60-80 ms, peak deceleration forces on the vehicle body reach their highest point. The structural goal is to maintain a rigid survival cell around occupants while the front of the vehicle progressively deforms. Intrusion into the footwell or dashboard - measured precisely by post-test laser scanning - directly correlates with lower extremity and thoracic injury risk.
150 ms
Duration of a full frontal crash event
A typical frontal barrier crash test is largely complete - structurally and biomechanically - in under 150 milliseconds, according to automotive crash dynamics research.
30+ g
Peak deceleration forces on occupants
Frontal barrier crash tests can subject the vehicle structure to sustained deceleration forces exceeding 30 times the force of gravity, underscoring why engineered energy management is essential.
35-40 mph
Typical frontal test speeds (NHTSA/IIHS)
NHTSA's frontal full-overlap test is conducted at 35 mph; the IIHS moderate overlap test is conducted at 40 mph - speeds selected to represent high-frequency serious-injury crash conditions in U.S. accident data.
Airbags deploy within 20-30 ms of a confirmed crash signal from accelerometers in the vehicle, inflating fully before the occupant dummy's forward motion brings their head toward the steering wheel. The restraint system - seat belt pretensioner firing, load-limiting webbing paying out - works in concert with the airbag to manage occupant deceleration over the longest possible time, reducing peak force on the thorax. Structural elements like the B-pillar play an equivalent role in side-impact containment.
Reading the Dummies: How Sensor Data Becomes a Score
Crash test dummies - Anthropomorphic Test Devices (ATDs) - are calibrated to biofidelic human surrogates representing a range of body sizes, from a small adult female to a large adult male. Each dummy contains dozens of sensors: triaxial accelerometers in the head, load cells measuring compression forces in the chest and neck, and strain gauges in the femur and tibia. Together they generate a time-history of forces experienced throughout the impact event.
Engineers apply established biomechanical injury thresholds - derived from decades of cadaver research, volunteer sled studies, and epidemiological accident data - to translate raw sensor readings into injury risk probabilities. For example, Head Injury Criterion (HIC) quantifies the likelihood of brain injury based on the magnitude and duration of head acceleration. Chest deflection measurements correspond to rib fracture and cardiac injury risk.
Check Which Configuration Was Actually Tested
IIHS publishes the exact trim level and build date of the vehicle evaluated in each test. If a manufacturer subsequently updated seat-belt geometry or added structural reinforcement, earlier test results may not reflect the current production vehicle. Always verify the model year and any mid-cycle structural revisions before relying on a published score.
These probabilities feed into NHTSA's star rating algorithm or IIHS's Good-Acceptable-Marginal-Poor scale. Critically, each rating applies only to the specific scenario tested. What crash ratings actually measure - and what they don't clarifies how these scores should - and should not - be interpreted.
Materials, Structure, and the Science of Controlled Failure
Modern vehicle safety cannot be separated from materials science. Ultra-high-strength steel (UHSS), aluminium, and advanced composites each have distinct energy-absorption characteristics. UHSS can be formed into thin, light sections that resist intrusion into the cabin, while softer, lower-grade steel sections are intentionally placed in crumple zones to buckle predictably. Engineers use finite element analysis (FEA) - computer simulations running millions of calculations - to model how a proposed structure will deform before a single physical prototype is built.
The goal is engineered, controlled failure: the front of the car absorbs energy; the cabin does not yield. This hierarchy of structural stiffness is tested and validated by the crash test outcome. Post-test measurements of pedal displacement, door-opening force, and roof crush (in rollover tests) confirm whether the survival space was maintained as designed.
For readers building a foundation in safety literacy, a first-time buyer's roadmap to crash test ratings translates these technical concepts into practical guidance for vehicle comparisons. And for a longer-term view of how test methodology itself has grown more rigorous, tracing the evolution of crash test programmes provides valuable historical context.