

Key Takeaways
Our Verdict
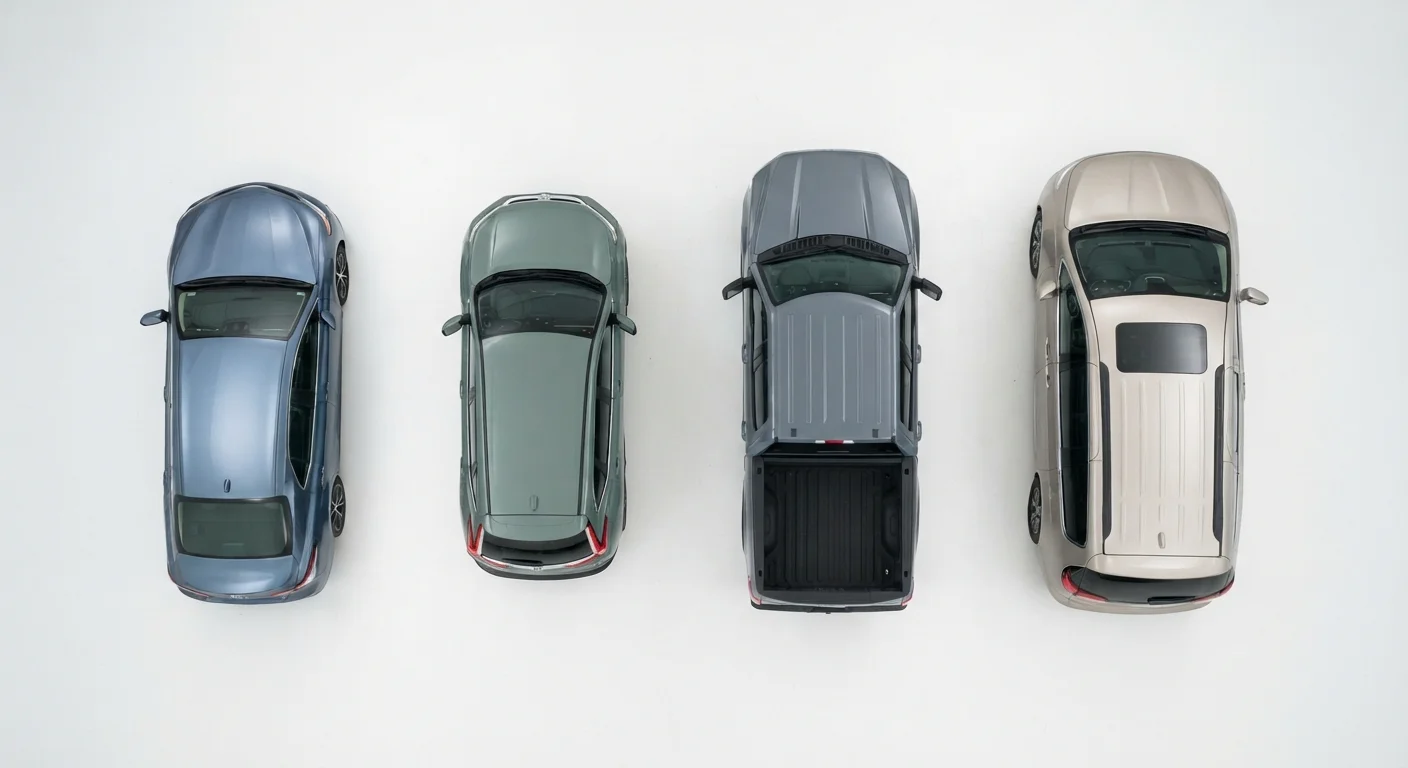
No single vehicle class earns a blanket safety advantage over others. Sedans, SUVs, trucks, and minivans are each tested against identical NHTSA and IIHS criteria, but their structural designs and mass distributions produce distinct patterns of strength and vulnerability. Comparing scores across classes requires understanding those structural differences, not just the headline numbers.
| Best for | Recommended |
|---|---|
| Passengers prioritizing frontal and side occupant protection | Sedans or minivans with Top Safety Pick+ recognition |
| Families needing space without sacrificing structural safety | Three-row SUVs evaluated under IIHS's updated 2023+ criteria |
| Truck buyers concerned about rollover and cab structure | Crew-cab trucks with high NHTSA rollover resistance ratings |
| Readers new to safety rating interpretation | Start with foundational crash test guides before comparing class scores |
How the Same Tests Produce Different Results by Class
Both NHTSA and IIHS apply consistent test methodologies across all passenger vehicle categories. A small overlap frontal test, a moderate overlap test, a side barrier test, and a roof strength evaluation are conducted the same way whether the subject is a compact sedan or a full-size SUV. What changes is how each vehicle's structure responds - and those responses follow predictable patterns tied to mass, ride height, and body construction.
If you're new to how these evaluations work, this primer on crash test ratings explains each test type and scoring scale before you attempt cross-class comparisons. For deeper context on the methodology's evolution, see how crash test programmes have evolved over three decades.
| Sedans | SUVs | Pickup Trucks | Minivans | |
|---|---|---|---|---|
| Frontal crash performance | Generally strong; well-optimized structures | Strong; larger crumple zones help | Variable; cab size matters significantly | Typically strong; fewer tested models |
| Side impact protection | Good; lower sill aids airbag geometry | Good; width allows longer curtains | Moderate; door height can complicate coverage | Good; wide cabin suits curtain coverage |
| Roof strength rating | Favorable; lower weight improves ratio | Moderate; heavier weight raises threshold | Variable; frame trucks tested differently | Favorable; unibody construction helps |
| Rollover resistance | High; low center of gravity | Moderate; higher CoG raises risk | Lower; especially non-crew cab configs | High; low floor, stable geometry |
| Collision compatibility risk | Higher; shorter in mixed-traffic crashes | Lower; height matches many vehicles | Elevated; hood can override car cages | Moderate; mid-height profile |
| IIHS test coverage depth | Extensive; most tested category | Extensive; broad model coverage | Moderate; fewer variants fully tested | Limited; small nameplate pool |
Sedans: Consistent Performance, Structural Clarity
Sedans have the longest testing history, and manufacturers have optimized their unibody construction around known test parameters. Frontal and side impact results in the sedan category tend to cluster at the higher end of IIHS ratings, partly because the lower center of gravity reduces dynamic instability during barrier contact. Roof strength, measured as the ratio of peak force to vehicle weight, typically favors sedans due to their relatively lower vehicle weight.
The primary limitation is compatibility: in collisions with taller, heavier SUVs or trucks, sedan occupants face elevated risk due to geometric mismatch. A detailed look at SUV-versus-sedan structural trade-offs explains how ride height and mass interact in real-world collisions. For a breakdown of what sedan-specific scores actually communicate, see reading a sedan's safety rating.
Compare Within the Same Model Year
Crash test programs update their protocols regularly, meaning a 2021 score and a 2024 score for nominally similar vehicles may reflect different test standards. Always check that you're comparing scores generated under the same evaluation cycle. IIHS publishes test year alongside ratings on each vehicle's results page.
SUVs and Trucks: Strong Structure, Rollover Tradeoffs
SUVs and trucks generally earn strong frontal and side ratings, aided by their larger crumple zones and reinforced frame or unibody structures. However, their higher center of gravity raises rollover risk - a dimension NHTSA captures with its rollover resistance star rating, derived from both dynamic handling tests and static stability factor calculations. Pickup trucks, especially extended and regular cab configurations, historically score lower in rollover resistance than four-door crew cabs.
A separate challenge involves the front-end geometry of body-on-frame trucks: the higher hood line can override a struck vehicle's safety cage rather than engaging it - a factor that formal crash tests don't fully replicate. Families evaluating SUVs and trucks should consult this guide to SUV and truck safety for families, which covers child seat anchoring, third-row protection, and NHTSA ratings in one place. The broader SUV and truck landscape is catalogued in our SUVs & Trucks hub.
~40%
Higher rollover rate for SUVs vs. sedans
NHTSA fatality data has consistently shown rollover crashes represent a disproportionately higher share of fatalities in SUVs and trucks compared to passenger cars.
2.5x
Roof strength requirement increase since 2009
NHTSA's upgraded roof crush standard, phased in after 2009, requires vehicles to withstand a load 2.5 times their own weight - applied uniformly across all passenger vehicle classes.
Minivans: Underrated Safety Performers
Minivans are tested infrequently relative to SUVs and sedans, but those that undergo full IIHS evaluation often perform well. Their low floor and wide cabin allow substantial side-curtain airbag coverage, and their unibody construction produces favorable roof strength scores. Rear-seat occupant protection - a dimension IIHS began evaluating more rigorously with updated seat and head restraint tests - is an area where minivans sometimes outperform taller vehicles whose rear seating geometry complicates airbag deployment geometry.
The main caveat is test coverage: because fewer minivan nameplates exist, the sample size is small and results shouldn't be broadly generalized. Always verify whether a specific model year has been independently tested, rather than relying on scores from a prior generation. For an honest account of what all crash ratings leave unmeasured, see where crash scores fall short.
Don't Rely on Carry-Over Scores
Automakers frequently update vehicle platforms mid-generation. A high safety score from a model tested three or four years ago may not apply to the current year's version if structural or airbag changes were made. Always look up the specific model year you're considering on NHTSA's and IIHS's official databases before drawing conclusions.
Applying Class-Aware Thinking When Comparing Scores
A five-star NHTSA overall rating on a midsize sedan and a five-star rating on a full-size SUV reflect equivalent performance on the same tests - but they don't mean those two vehicles are equally safe in every scenario. The sedan excels in low-center-of-gravity stability; the SUV provides more frontal crush space. Neither score captures the collision partner effect or real-world fleet composition.
Effective safety comparison means reading within-class results carefully, checking model-year-specific scores (not class averages), and factoring in IIHS's advanced driver-assistance evaluations, which now influence Top Safety Pick and Top Safety Pick+ designations. The complete vehicle safety ratings reference consolidates NHTSA and IIHS methodology, test scenarios, and score interpretation in one resource. Cross-class shopping across sedans and coupes versus SUVs is most productive when grounded in that methodological context.
This article is for general informational and educational purposes. Safety ratings reflect laboratory test conditions and should be considered alongside real-world driving behavior, vehicle maintenance, and other factors. Consult official NHTSA and IIHS resources for the most current model-year data.