

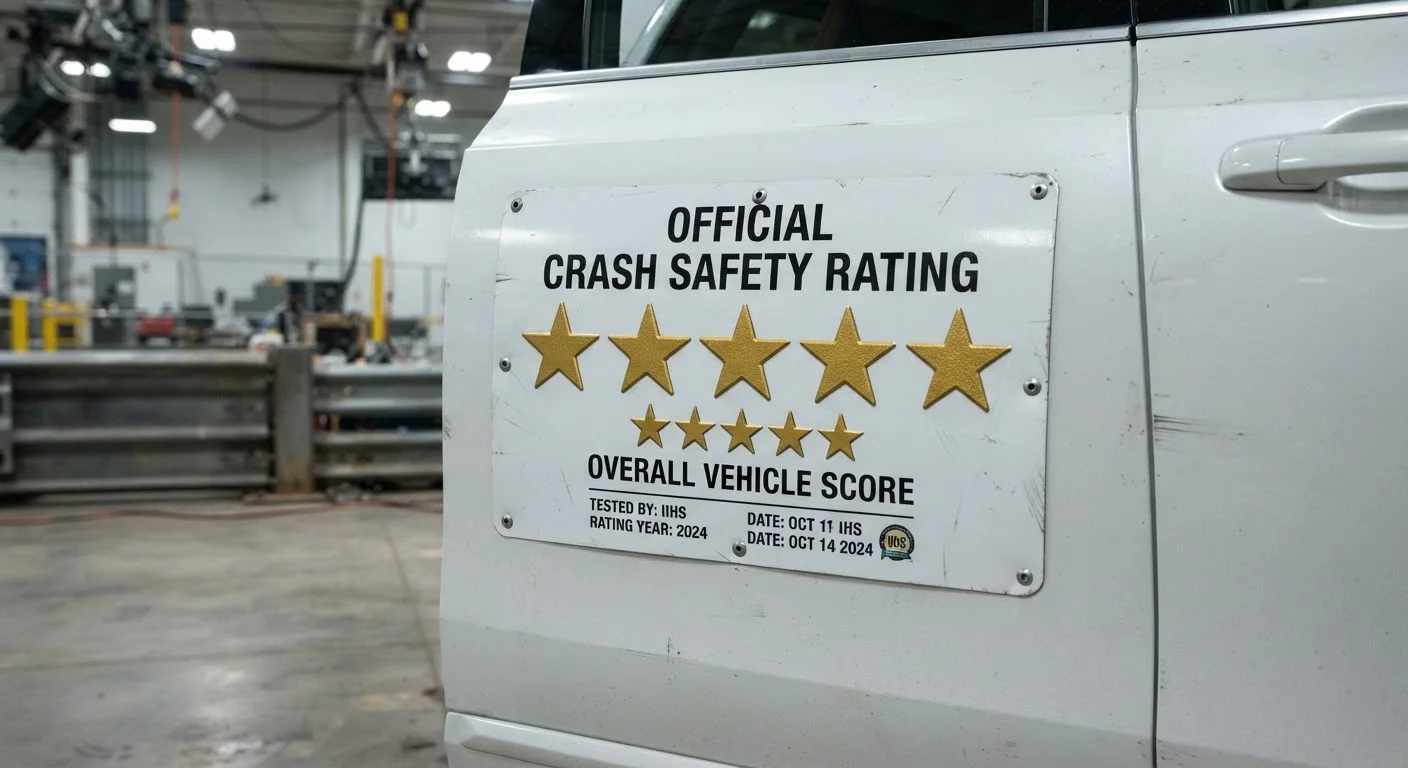
| Rating Organization | National Highway Traffic Safety Administration (NHTSA) |
| Scale | 1 to 5 stars (5 is highest) |
| Categories Rated | Frontal crash, side crash, rollover resistance (NHTSA NCAP program) |
| 5-Star Injury Threshold | ≤10% probability of serious injury (NHTSA NCAP methodology) |
| 3-Star Injury Range | 21-35% probability of serious injury (NHTSA NCAP methodology) |
| Active Safety Systems | Rated separately; not included in crash-test star scores (NHTSA SaferCar program) |
How NHTSA's Five-Star Scale Is Structured
The National Highway Traffic Safety Administration (NHTSA) runs the NCAP program, which crash-tests new vehicles and publishes results on a one-to-five-star scale. Unlike a single composite score, NHTSA issues separate star ratings for frontal crash performance, side crash performance, and rollover resistance - meaning a vehicle can score differently across categories.
| Rating Organization | National Highway Traffic Safety Administration (NHTSA) |
| Scale | 1 to 5 stars (5 is highest) |
| Categories Rated | Frontal crash, side crash, rollover resistance (NHTSA NCAP program) |
| 5-Star Injury Threshold | ≤10% probability of serious injury (NHTSA NCAP methodology) |
| 3-Star Injury Range | 21-35% probability of serious injury (NHTSA NCAP methodology) |
| Active Safety Systems | Rated separately; not included in crash-test star scores (NHTSA SaferCar program) |
Ratings are generated by measuring the forces acting on crash-test dummies fitted with sensors during standardized laboratory impacts. Those force readings are translated into injury-risk probabilities, which then map to a star tier. A higher star count signals a statistically lower probability of serious injury - not an absolute guarantee of safety in any specific real-world crash.
For a broader comparison of how NHTSA results relate to other international testing bodies, see how Euro NCAP and NHTSA ratings compare.
What Each Star Level Actually Means
Understanding the tiers requires looking at the injury-risk percentages behind each rating rather than treating stars as an abstract prestige ranking.
Serious Injury Probability
A statistical estimate - expressed as a percentage - of the likelihood that an occupant in a standardized crash test would sustain a serious injury. NHTSA derives this figure from sensor readings on crash-test dummies and uses it to assign star ratings.
Crash-Test Dummy
An instrumented anthropomorphic test device designed to represent a human occupant during a controlled crash. Sensors embedded throughout the dummy measure forces on the head, chest, legs, and other body regions during impact.
Crumple Zone
A deliberately engineered section of a vehicle's front or rear structure designed to deform progressively during a collision, absorbing kinetic energy and reducing the force transmitted to the passenger cabin.
Rollover Resistance Rating
An NHTSA star rating that estimates a vehicle's likelihood of rolling over in a single-vehicle crash. It combines results from a dynamic fishhook maneuver test with a statistical model based on the vehicle's physical dimensions.
NCAP
The New Car Assessment Program, operated by NHTSA, is the US government's consumer vehicle safety information initiative. It conducts standardized crash tests and publishes star ratings to help consumers compare vehicle safety performance.
- 5 Stars: Indicates a 10% or lower probability of serious injury in the tested crash type. This represents the highest performance tier - vehicles here absorb and redirect crash energy most effectively.
- 4 Stars: Reflects an 11-20% serious injury probability. Still a strong result; most well-engineered modern vehicles land here or above.
- 3 Stars: Corresponds to a 21-35% probability range. Occupant protection is adequate but meaningfully below top-tier performance. The gap between three and five stars is not cosmetic - it represents a material difference in injury risk.
- 2 Stars: Indicates a 36-45% serious injury probability. NHTSA treats this as a below-average result, and vehicles rated here may warrant closer scrutiny.
- 1 Star: Signals greater than 45% probability of serious injury - the lowest performing tier. One-star results are rare in modern vehicles but do appear in older or budget-segment models.
Rollover ratings use the same star scale but are derived differently: NHTSA uses a dynamic handling test combined with a statistical model based on the vehicle's center of gravity height and track width to estimate rollover risk.
≤10%
Serious injury probability at 5 stars
According to NHTSA's NCAP injury-risk methodology, a five-star rating indicates a 10% or lower probability of serious injury in the tested crash scenario.
~25 pp
Injury probability gap between 3 and 5 stars
Depending on the specific test and vehicle, moving from a three-star to a five-star frontal rating can represent roughly a 15-25 percentage-point reduction in serious injury probability.
3
Separate crash categories rated by NHTSA
NHTSA issues distinct star ratings for frontal crash, side crash, and rollover resistance - a single vehicle may score differently across all three.
To understand how to read an official results page without getting lost in the data, see reading a vehicle safety report.
Why the Gap Between Three and Five Stars Matters
A two-star difference on the NHTSA scale is not a minor distinction. Moving from a three-star to a five-star frontal rating can represent roughly a 15-25 percentage-point reduction in serious injury probability, depending on the specific vehicle tested. At population scale - millions of crashes annually - that difference translates into meaningful real-world outcomes.
Several structural factors separate high-rated vehicles from lower-rated ones:
- Crumple zone engineering: Five-star vehicles typically feature more precisely engineered front and rear crush structures that absorb energy progressively rather than transferring it abruptly to the occupant cabin.
- Occupant restraint tuning: Advanced airbag deployment timing and load-limiting seat belt pretensioners reduce chest and head forces on dummies - directly improving scores.
- Cabin structural integrity: Side ratings in particular reflect how well the door pillars and roof rail resist intrusion during a lateral impact.
It is equally important to recognize what the stars do not capture: active safety systems such as automatic emergency braking, lane-keeping assist, and blind-spot monitoring are assessed separately under NHTSA's SaferCar program and are not factored into crash-test star ratings themselves. For guidance on those technologies, see the Safety Tech Explained hub.
Star ratings also apply only to the specific trim and body configuration tested. A different body style or powertrain variant of the same nameplate may produce different results. Always verify the exact tested configuration against the vehicle you are evaluating. For a deeper look at what lies beyond the numbers, see the factors that matter beyond a star rating.
When comparing safety scores across vehicle types - including sedans and crossovers - the methodology behind each test matters as much as the number itself. Reading a sedan's safety rating walks through what those scores genuinely indicate.
This article provides general educational information about NHTSA crash-test ratings and is not a substitute for consulting official NHTSA data or a qualified automotive safety professional when making vehicle-purchasing decisions.