

Key Takeaways
Reliability Survey Methodology
Reliability survey methodology refers to the specific processes, data sources, and measurement criteria that consumer research organizations use to rank how dependable vehicles are. These surveys typically ask owners to report problems they experienced with their vehicles over a set period - usually the first 12 months of ownership or across several years. The resulting scores reflect owner-reported issues, not objective mechanical testing conducted in a lab.
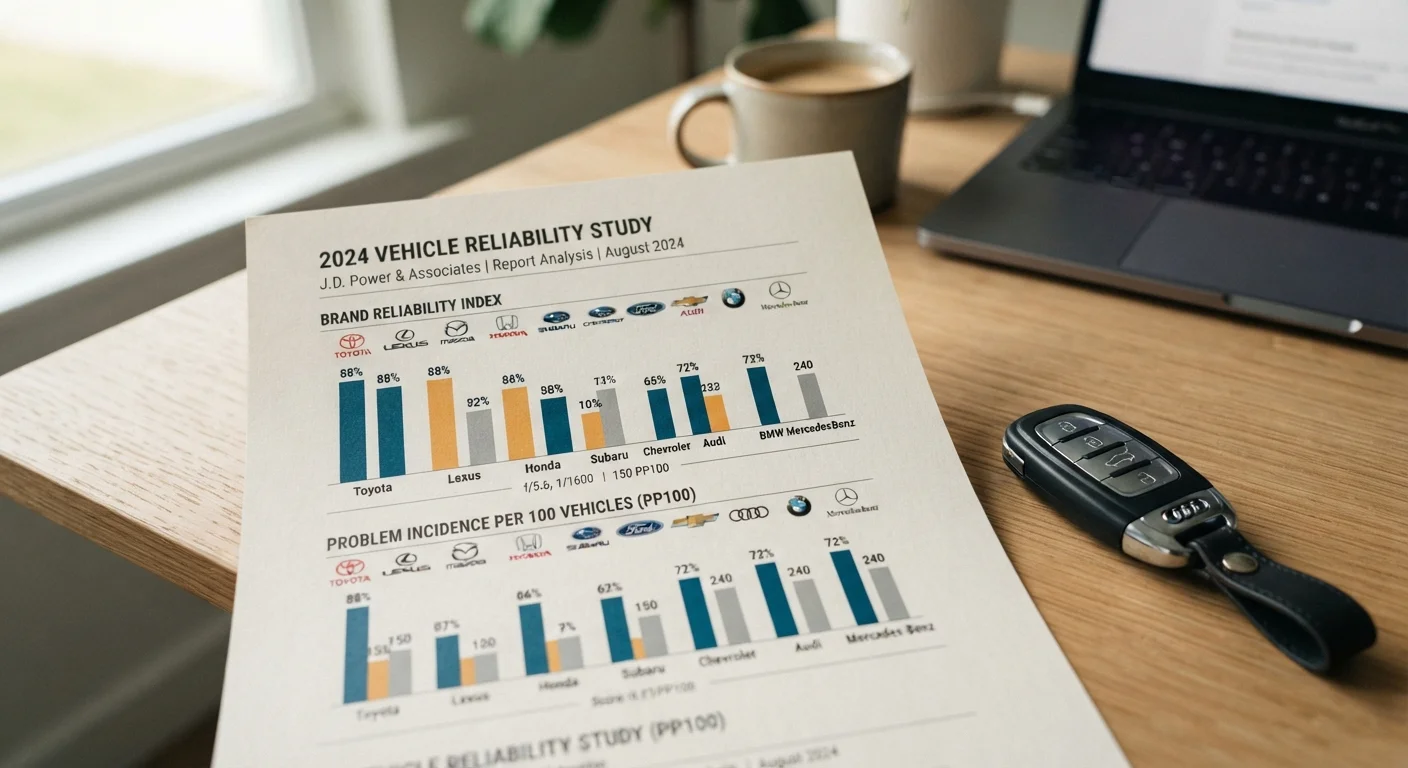
Most major surveys measure problems per 100 vehicles (PP100), where lower scores indicate fewer reported problems. Scores are model-year specific, meaning a single brand can vary significantly across different vehicle lines and generations.
How the Major Surveys Collect Their Data
The two most influential reliability surveys in the U.S. automotive market - J.D. Power's Vehicle Dependability Study (VDS) and Consumer Reports' owner satisfaction surveys - share a common foundation: they ask real owners to report problems they've experienced. Beyond that, their approaches diverge in meaningful ways.
J.D. Power's VDS surveys owners of three-year-old vehicles, capturing problems experienced in the preceding 12 months. Results are expressed as problems per 100 vehicles (PP100), with lower scores indicating fewer reported issues. Consumer Reports relies on annual member surveys covering multiple model years simultaneously, producing a predicted reliability score that aggregates data across trouble categories like engine, transmission, and in-car electronics.
Neither survey involves engineers disassembling vehicles or running stress tests. What they capture is owner perception of problems - which can include anything from a rattling trim piece to a failed powertrain. Both organizations categorize problems by system, but the granularity and weighting of those categories differ, which is why a vehicle can rank differently across the two surveys.
Surveys Measure Perception, Not Absolute Failure Rates
Owner-reported problems vary based on expectations, familiarity with the vehicle, and how a question is framed. Two owners experiencing the same issue may describe it differently, or one may not report it at all. This means survey scores reflect both actual problems and the owner experience surrounding them - a distinction worth keeping in mind when interpreting rankings.
What Gets Counted - and What Doesn't
Understanding what these surveys exclude is as important as understanding what they include. Most reliability surveys do not measure:
- Long-term durability past the survey window (typically 1-3 years of ownership)
- Severity of problems - a squeaky door handle counts alongside a transmission failure
- Cost of repairs or whether a problem was covered under warranty
- Recall frequency, which is tracked separately by NHTSA
This matters considerably for used car buyers. A vehicle that scores well in a 3-year dependability study may develop costly issues at higher mileage that no survey captures. When buying a used car, reliability survey data should be one input among several - not the sole determinant of a purchase decision.
PP100
Problems per 100 vehicles metric
J.D. Power uses this as its standard reliability unit; a lower score means fewer owner-reported problems across the survey period.
3 years
Typical VDS vehicle age at survey
J.D. Power's Vehicle Dependability Study targets owners of three-year-old vehicles, capturing issues from that ownership window only.
17+
Problem categories tracked per vehicle
Major reliability surveys segment issues across systems including engine, transmission, electronics, HVAC, and body hardware to isolate problem patterns.
Why Asian Brands Repeatedly Surface at the Top
The consistent appearance of Japanese and Korean automakers near the top of reliability rankings reflects genuine engineering patterns - though it is not the whole story. Japanese manufacturers in particular have long favored proven powertrain configurations, slower model refresh cycles, and deep supplier relationships built around defect reduction. These practices reduce the probability of unproven components introducing problems during the survey period.
Newer or heavily redesigned models - regardless of brand origin - tend to score worse in their first model year. Asian brands with longer development cycles and more conservative specification changes benefit in surveys that capture early ownership experience. For a detailed look at the engineering and cultural factors behind this pattern, see why Asian automakers have dominated reliability rankings for decades.
American brands have made measurable reliability gains over the past two decades. The gap between domestic and Asian manufacturers has narrowed in several categories, a trend explored in depth in our piece on the reliability reputation of American cars.
“Reliability data is most powerful when used comparatively - not as an absolute verdict, but as a signal about engineering maturity and manufacturing consistency across a given model's production run.”
— Automotive Quality Analyst, Industry researcher specializing in vehicle quality benchmarking
Applying Survey Data Practically
Reliability rankings are most useful when applied with specificity. A brand-level score tells you relatively little about the particular model and model year you're evaluating. Drill down to the model-level data, check consistency across at least two or three model years, and cross-reference between survey organizations where possible.
For SUV shoppers in particular, powertrain configuration and transmission type have an outsized influence on long-term dependability - factors that survey data can flag but not fully explain. Our analysis of SUV reliability over time covers the mechanical dimensions that sit behind the numbers.
Before finalizing any vehicle decision, pair reliability data with safety rating verification. Our safety ratings checklist provides a structured framework for confirming crash test results alongside dependability data - two distinct dimensions that together give a more complete picture of a vehicle's ownership profile.
Check Model-Year Data, Not Just Brand Rankings
When using reliability surveys to inform a purchase, always look at the specific model year you're considering - not just the brand's overall position. A model that ranked poorly during its redesign year may have improved significantly in subsequent years as engineers addressed early issues. Consistency across three or more years of data is a stronger signal than any single survey result.